The Math Behind Unemployment
Unemployment can be a difficult beast to track as the numbers and the weight of positions, applications and status can be ambiguous and vary from employer to employer. A thing I’ve learned while making my way through the application process is that from the employer perspective, it’s usually messy. If hiring was more standardized and the recruitment process more regimented it would lend more certainty to the applicants and the process itself.
But, there are numbers we can be certain of and those are the ones we track ourselves. As we search for work we should be vigilant and track the numbers at our disposal, these will give us insights into the application process and assurances, to some degree, on our performance.
With that being said I’ve put together a spreadsheet to help you on your way. Here are the basics of how it works. As you apply for jobs, track the company, the position and the initial date of the application. As the job interviews come in you will need to track those dates in the designated columns for Round 1, Round 2 and Round 3 (anything after Round 3 you can disregard).
The immediate insights provided are the total number of applications, percentages of time you made it Round 1, Round 2 and Round 3 from the initial application as well as how likely you are to make it to Round 2 from the first round and Round 3 from the second. Additionally you can track the length of the process from application to the third round as well as the time in between.
I’ve shared the link to the spreadsheet here - https://www.dropbox.com/s/2kn4r9oe6j9vz89/Personal%20Unemployment%20Statistics.xlsx?dl=0
In my own version of the spreadsheet I’ve found that 17% of the time I’ve made it to Round 1 which then gives me a 46% chance of making it to the second round and a 50% chance of getting to the third from the second. Overall there’s an 8% chance of making it to Round 2 and a 4% chance of making to Round 3. This is where the math gets fuzzy because that not 4% of 20, the number of applications is actually much higher. Also, what were the jobs and what were the positions? Maybe I’m more qualified for some positions I’m applying for than others. You can see how weight, relevance, timing and so on can effect your score.
This is where pivot tables come in handy. In my own version of the spreadsheet I’ve added a column for Category and compared the position types to Rounds 2.
Round 2 Column (before the totals)
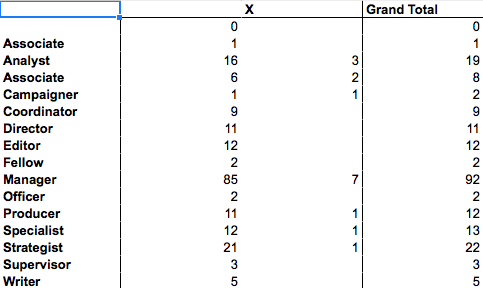
You can see I’ve faired well with Analyst and Associate positions and less so with Director and Editor positions in terms of getting to Round 2. Statistically Round 3 numbers are insignificant while the odds of getting there from Round 2 are fairly high, so I’ll skip those.
So what assurances can you draw from this data? You get a sense for how long the process takes from start to the third round. I found that I’m at 17% for getting to the first round while the national average is closer to 10%. Not bad. You can determine the likelihood that you’ll continue on based on the position you’ve applied for. It looks like maybe I should apply for more Analyst and Associate positions as those have done fairly well to this point.
For positions that aren’t getting you to the first round, you need to think about why that’s the case? Maybe it’s the language in your resume or maybe the timing (do you have a job alerts set up?) of the application. The other thing to think about is how easy you can pigeon hole yourself and search for jobs based on only a few keywords, maybe you need to expand you search?
Good luck and feel free to share your thoughts with me on Twitter at @scottindc.